


Modern microservice-based applications can be made up of many components, potentially distributed across cloud providers or data centers. For decades, distributed systems have posed gnarly debugging challenges, and this is still the case with microservices. Distributed tracing is a pattern applied to track requests as they traverse the distributed components of an application. Typically used to pinpoint failures, distributed tracing can also be used to track performance and gather statistics to optimize your application over time. To get it right, however, developers and operations need to ensure that QA staff is involved as well.
What Distributed Tracing Isn’t
I usually avoid starting with a negative, but let’s clarify what distributed tracing is by exploring what it isn’t. Then we’ll move onto what it helps solve. Typical application logging is functional in nature, meaning it’s added to assist transaction processing, future auditing requirements, and as a general record of activity potentially used for billing. Adding stand-alone logging to your individual services might be helpful and even crucial to debugging issues, but it’s nearly impossible to correlate logs from distributed components and attribute them to a single troublesome request.
This is where tracing comes in, specifically when it’s used to track processing across components to handle an individual user request. Tracing requests across component logs, with metrics and automated tagging, allows you to efficiently track activity with varying levels of granularity you can change as needed.
Use Distributed Tracing with Your Microservices
Your application is only as good as your worst-performing service. This goes for performance and uptime. Distributed tracing can be applied to debug your individual microservices themselves. It helps gain full visibility into your application performance with end-to-end tracing, including breakdowns of potential latency impact per user request.
To guarantee uptime and to honor SLAs (service level agreements) with your customers, you need to know which services may be less than optimal. Well implemented distributed tracing will help your QA teams understand how updates to services affect your users, and help them know which service(s) need to be rolled back in case of issues. Proper visualization will show, in an instant, which deployments correlate to spikes in performance or drops in availability.
Real-time analytics of your tracing data can identify critical issues as they occur, helping you uncover performance and reliability issues, potentially before your users do. However, you need to include application infrastructure, networking, and browser code in your distributed tracing. Be sure to collect both the JavaScript console logs and other HTTP-related logs from within browsers to uncover slowdowns attributed to clients and last-mile connectivity issues.
Whole-Application Distributed Tracing
When monitoring a cluster, cloud provider, or data center as a whole, you may see 100% availability. But to the customer whose request went through a momentarily troubled server, microservice, or container, your entire application will appear slow or even unavailable. If you serve one million requests per day, for example, having an issue with just 1% of those requests means 10,000 users are impacted! With distributed tracing, overall performance and availability is measured by analyzing each user transaction through each service and component that makes up your application.
Beyond microservices, you need to include other software components in your tracing implementation such as databases, cloud and on-premise web and application servers, serverless frameworks, containers and VMs, and even legacy applications. Taking a holistic view allows you to analyze user experience quickly, on both the individual and aggregate level.
This begins with unique request IDs that are assigned via user sessions, as requests are made, and are then passed along to each service and component request made to generate a result. But it goes beyond a simplistic request ID. You need a framework to measure and visualize the tracing to derive value from it, the ability to control and automate it, and ensure you don’t create new issues as a result.
For instance, since distributed tracing occurs at a low level, the potential volume of trace messages is much higher. To avoid impacting performance, it's often desirable to control this tracing either at compile-time or run-time. Building support or leveraging a distributed tracing framework or tool that supports run-time control ensures your ability to diagnose issues in deployed code.
Using Distributed Tracing for QA
Understanding performance and availability in a deployed application is powerful, but you could argue that it’s too late; the user may already be impacted. Distributed tracing is another tool to be used during the QA and testing phases of new software development. With agile and continuous deployment, distributed tracing can be continuously applied throughout the entire development cycle.
First, distributed tracing enables QA to verify that data and other workflows are behaving as designed. Ensuring that unintended dependencies aren’t occurring at runtime helps to avoid unpredictable latencies that might otherwise occur. For instance, calling a new service that was built as a thin layer on top of a database might insert query-related latency as larger numbers of simultaneous requests occur.

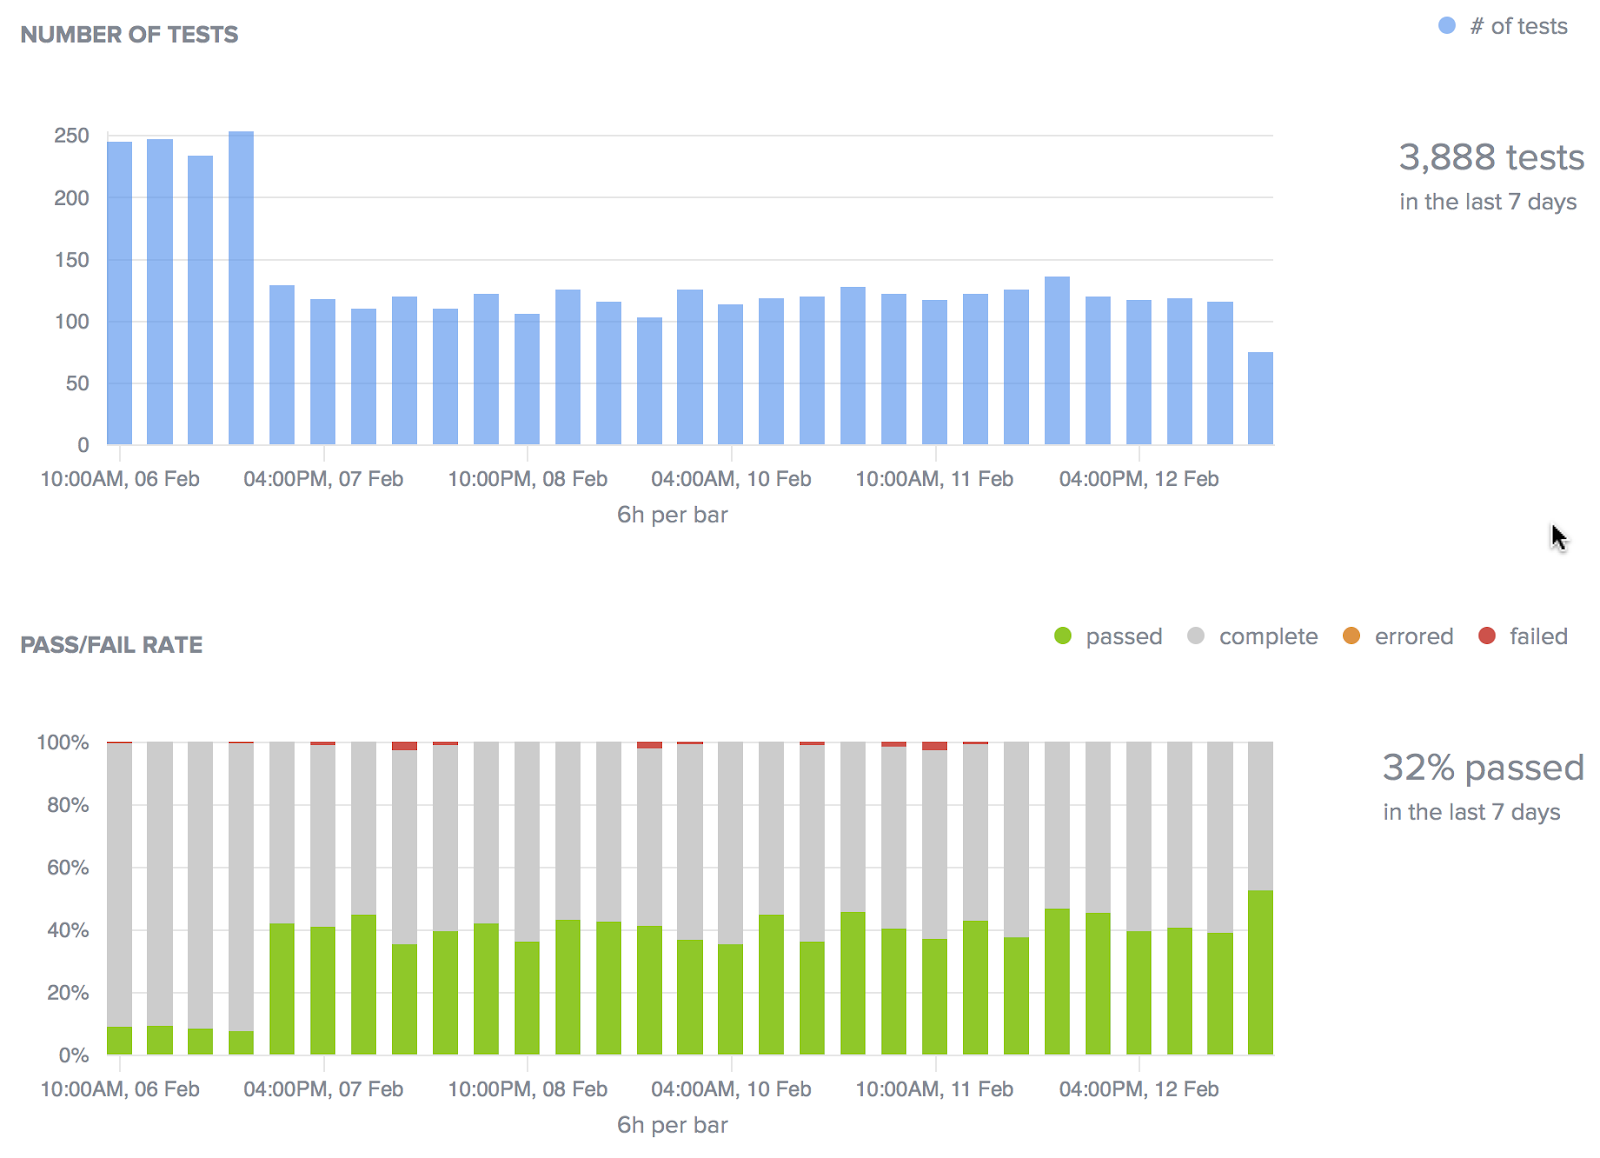
Secondly, as QA inserts deliberate latencies and failures into the application (think chaos monkey), distributed tracing helps to uncover the rippling and cascading effects that can otherwise be masked. For example, the failure of a caching layer can put added stress on other data-related microservices, resulting in a wide-spread performance impact that is hard to diagnose without proper tracing. The visualization of trends analytics, as shown above, is one way to measure these effects.
Next, distributed tracing helps to enable root cause analysis, providing the ability to pinpoint individual user impact to a component or service. With distributed tracing and its supporting tools, QA can quickly get to the root cause of an issue when issues arise or users complain. Not only does this help resolve problems quickly, it does so more efficiently, with less effort, overhead, and cost compared with traditional server monitoring.
Additionally, don’t discount the value distributed tracing adds to developers. The tracing code itself serves as comments and trace-backs from real-world events to the specific code that was involved. This alone adds value to root cause analysis, and is often overlooked or discounted during the QA phase.
Conclusion: Distributed Tracing for QA Live Testing
Nothing comes for free; there are some considerations to make when it comes to distributed tracing. For example, it’s important to ensure that sensitive information is kept from the logs. This includes user identities; privacy concerns such as healthcare data, payment data, or other information that should be kept private; key application architecture that can cause security concerns; contact information for developers or other key personnel; and so on.
As stated above, improperly implemented or granular tracing can negatively impact performance. It’s best to leverage a framework that supports the enablement of different levels of distributed tracing during testing and in production to control and mitigate its effects without sacrificing its value.
Your development and QA teams can debug faster and more effectively with distributed tracing applied to real devices and browsers, across combinations of platforms and cloud providers. As a result, your entire IT organization will understand and visualize test results such as test failure rates, error rates across each service and application component, and the effects of scale as traffic grows.

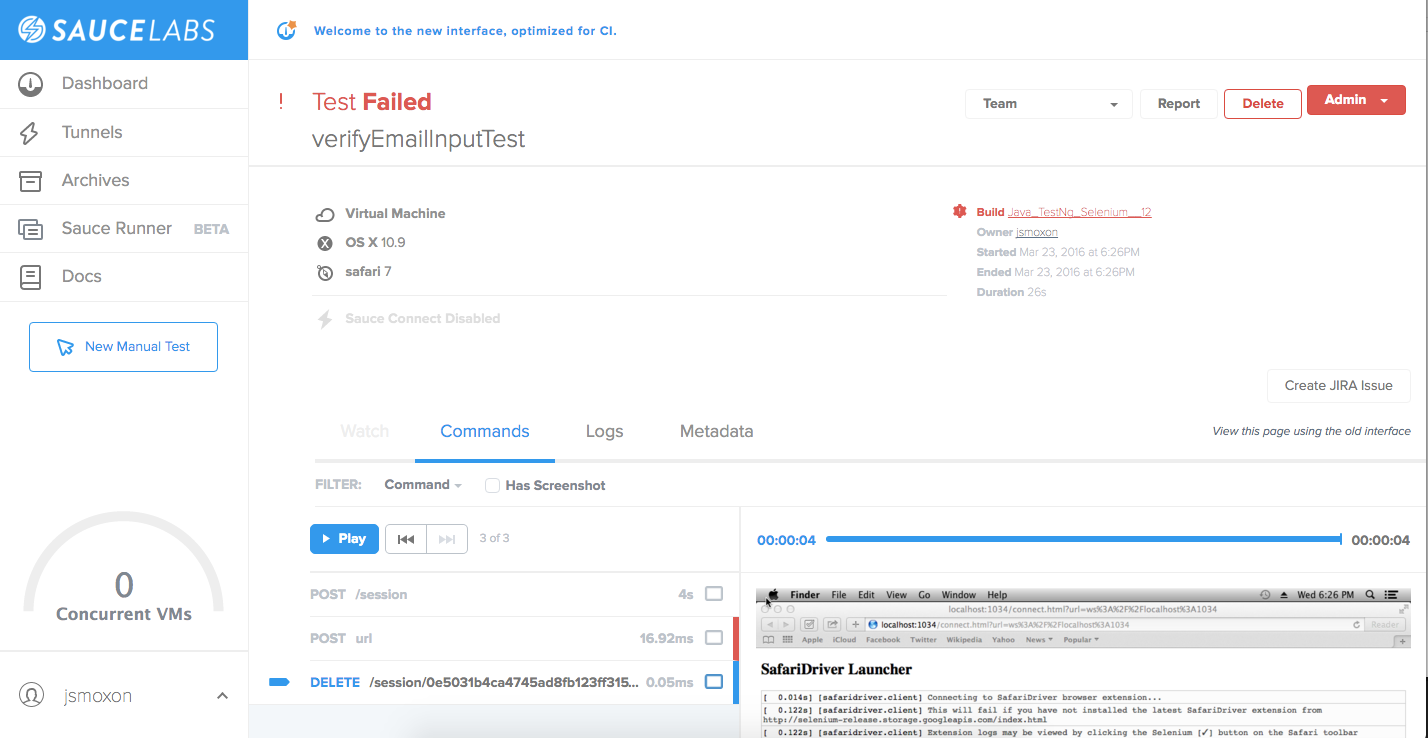
As shown above, applying a testing framework to your distributed tracing means you can simulate the effects of API failures, network congestion, failed cloud connectivity, reduced bandwidth, container failures, bad user input and more in the QA phase before real customers (and your business) are impacted.
Eric Bruno is a writer and editor for multiple online publications with more than 20 years of experience in the information technology community. He is a highly requested moderator and speaker for a variety of conferences and other events on topics spanning the technology spectrum from the desktop to the data center. He has written articles, blogs, white papers, and books on software architecture and development topics for more than a decade. He is also an enterprise architect, developer, and industry analyst with expertise in full lifecycle, large-scale software architecture, design, and development for companies all over the globe. His accomplishments span highly distributed system development, multi-tiered web development, real-time development, and transactional software development. See his editorial work online at www.ericbruno.com.


